The crypto fear and greed index scores market mood from 0 to 100. Here's how to read it, and where it misleads.
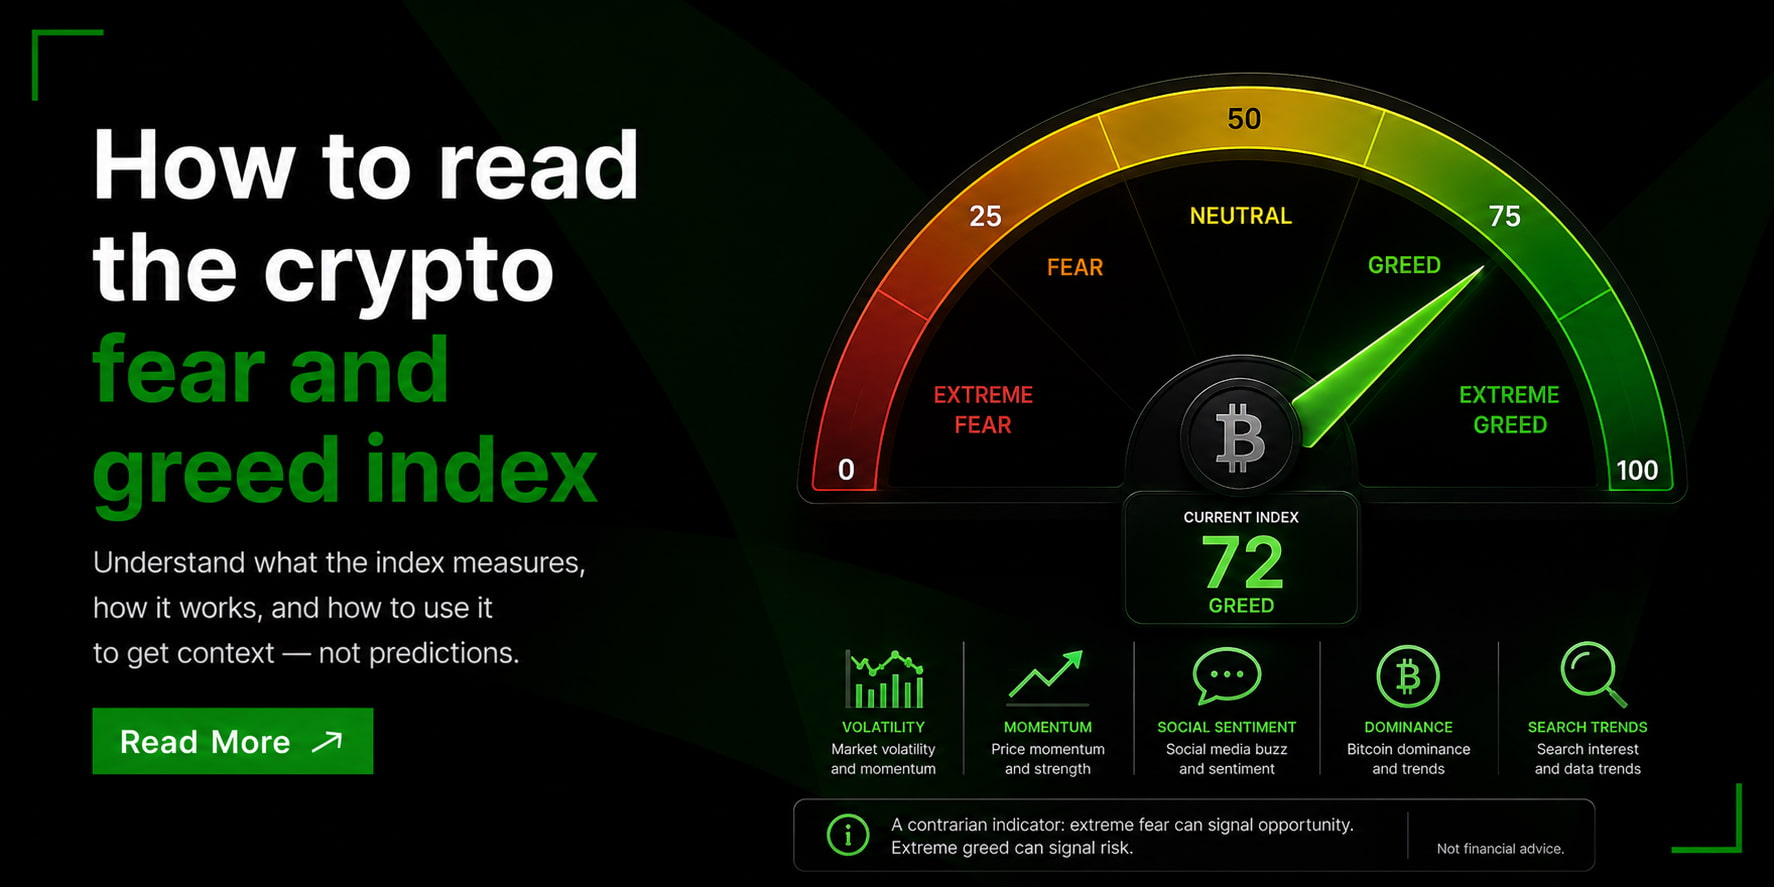
The crypto fear and greed index is a single number, from 0 to 100, that tries to capture the mood of the entire crypto market at a glance. Zero means the crowd is gripped by fear. One hundred means it is euphoric with greed. For many traders, it is one of the first things they check each morning, the way the rest of us check the weather.
It is genuinely useful, and genuinely easy to misread. This guide explains what the crypto fear and greed index is, how it is calculated, the idea behind it, how to use it well, and the limitations that trip people up. No hype, no jargon, and no telling you when to buy or sell, just a clear picture of what the number can and cannot do.
The crypto fear and greed index is a sentiment gauge. It takes the two emotions that drive markets more than any others, fear and greed, and boils them down into one score between 0 and 100. A low score means fear is dominating, a high score means greed is, and the middle means the two are roughly balanced.
The idea is not new. CNN built the original Fear and Greed Index for the stock market in 2012, and the first crypto version was launched by the site Alternative.me in 2018. Since then, several providers have published their own versions. They all share the same goal: to measure crypto market sentiment in a way that is quick to read and hard to ignore.
The index sits on a scale from 0 to 100, split into zones that describe the mood. The exact cut-offs vary slightly between providers, but the picture looks like this.
| Score | Zone | What it suggests |
|---|---|---|
| 0 to 24 | Extreme fear | The crowd is very anxious, often after a sharp sell-off |
| 25 to 44 | Fear | Caution and nervousness dominate |
| 45 to 55 | Neutral | No strong emotion in either direction |
| 56 to 75 | Greed | Optimism and rising confidence |
| 76 to 100 | Extreme greed | Euphoria and FOMO, often after a strong rally |
Extreme fear usually follows a sharp fall, when the crowd is anxious and selling. Extreme greed usually follows a strong rally, when optimism tips into FOMO, the fear of missing out. These emotional peaks and troughs often line up with the tops and bottoms of the wider Bitcoin market cycle, which is part of why the index draws so much attention.
The index is a metascore, meaning it blends several inputs into one number. The most widely used version, from Alternative.me, draws on six factors, each given a different weight.
| Factor | Weight | What it measures |
|---|---|---|
| Volatility | 25% | Price swings and drops versus recent averages; unusual spikes suggest fear |
| Momentum and volume | 25% | Buying activity and momentum versus recent averages; strong buying suggests greed |
| Social media | 15% | The volume and tone of crypto posts and engagement, mainly on X |
| Bitcoin dominance | 10% | Bitcoin's share of the market; a rising share can signal caution |
| Google Trends | 10% | Search interest in Bitcoin terms; anxious searches suggest fear |
| Surveys | 15% | Weekly polls of investor sentiment (currently paused) |
Two things are worth noting. Volatility and momentum together make up half the score, so the index is heavily influenced by recent price action, which means it partly just describes what prices have already done. And the survey input, once gathered from weekly investor polls, is currently paused, so live readings lean on the other five factors. Other providers use their own mix of inputs, which is why two indices can show different numbers on the same day.
Why would anyone track the crowd's mood? Because the index is built on a contrarian idea: that the crowd is often most wrong at the extremes. The principle is captured in a famous line from the investor Warren Buffett, that you should be fearful when others are greedy, and greedy when others are fearful.
Applied to the index, the theory runs like this.
Extreme fear can mean investors have become too pessimistic and have sold heavily, which some read as a sign the market may be oversold. Extreme greed can mean optimism has run too hot, which some read as a sign the market may be overdue for a pullback. It is important to be clear, though: this is a way of interpreting sentiment, not a signal to buy or sell. The index describes how people feel, not what prices will do next.
The index is most useful as one input among many, a dashboard reading rather than a command. A few habits help you get value from it without being misled.
A single reading tells you today's mood. The direction tells you more. An index moving from 30 to 40 is still in fear, but the mood is improving, which can be more telling than the raw score. Following the trend over days and weeks gives context that a single number cannot.
Sentiment is only one layer. Experienced traders read it alongside price structure, trading volume, market liquidity, and the wider economic picture. A fearful reading during a longer-term uptrend can mean something very different from the same reading during a clear breakdown.
The index tends to be most informative at its edges. Long stretches of neutral or mild readings carry little signal, while extreme fear and extreme greed mark the moments when the crowd's emotions are running hardest, and when it is most worth checking your own before acting.
For all its popularity, the index has real limits, and the people who use it best are clear-eyed about them.
The original index is built primarily on Bitcoin data, so it reflects Bitcoin's mood more than the whole market. Sentiment for Ethereum, altcoins, and smaller tokens can move very differently, especially during sharp swings, so the index is a poor guide to anything beyond the largest coins.
The index is a mirror, not a map. It is good at telling you how the crowd feels right now, and it cannot tell you what happens next. Because much of its input is recent price action, it partly just describes what prices have already done, rather than predicting anything.
A common trap is assuming an extreme reading must reverse quickly. It need not. Sentiment can stay stuck in extreme fear or extreme greed for weeks or months, and prices can keep falling or rising the whole time. The index cannot tell you when the mood will turn.
Because each provider uses its own method, readings differ. Alternative.me runs the original version, CoinMarketCap publishes its own with a different mix of inputs, and others exist too. The exact number matters less than the broad message: is the market fearful, neutral, or greedy?
Most of the trouble people get into with the index comes down to a handful of avoidable errors. Watch for these.
It is a score from 0 to 100 that measures the mood of the crypto market. A low number means investors are fearful, a high number means they are greedy, and the middle is neutral. It blends factors like volatility, momentum, and social media sentiment into one figure, so you can read the market's emotional state at a glance.
Roughly, 0 to 24 is extreme fear, 25 to 44 is fear, 45 to 55 is neutral, 56 to 75 is greed, and 76 to 100 is extreme greed. The exact cut-offs vary a little between providers. Extreme fear tends to follow sharp falls, and extreme greed tends to follow strong rallies, when emotions run highest.
The most common version, from Alternative.me, combines six weighted factors: volatility and momentum (25% each), social media and surveys (15% each), and Bitcoin dominance and Google Trends (10% each). The survey input is currently paused. Volatility and momentum together make up half the score, so the index leans heavily on recent price movement.
Some traders read extreme fear as a possible sign the market is oversold, based on the contrarian idea behind the index. But the index is not a buy signal. It reflects mood rather than future prices, and it can stay in extreme fear for a long time while prices keep falling. Any decision should rest on your own research and broader analysis, not a single sentiment score. This is general information, not financial advice.
It is a useful gauge of market sentiment, but it is not a predictor of prices. It reflects Bitcoin more than the wider market, it looks backward rather than forward, and different providers report different numbers. Used as one input alongside other tools, it is helpful. Used on its own as a timing signal, it can mislead.
Sentiment gauges are easier to put in context with guidance behind you. UpTrade is a dedicated crypto brokerage built around real relationships, not a self-serve app you navigate alone.
UpTrade is an AUSTRAC-registered digital currency exchange provider (DCE100856266-001). You can read more about registered providers at austrac.gov.au.
General information only. This article is for educational purposes and does not constitute financial, investment, legal or tax advice, nor a recommendation to buy, sell or hold any asset. Cryptocurrency is a high-risk asset and you should consider your own circumstances and seek independent advice before making any decision. UpTrade does not make price predictions.

Market updates, new explainers and the occasional Alpha Pro report, sent once a week. Unsubscribe anytime.